India’s industrial economy began the new financial year with a steady expansion, as factory output grew 4.9 per cent in April 2026 under the revised Index of Industrial Production series. The latest data marks the first release of the new IIP series with 2022–23 as the base year, replacing the older 2011–12 framework and giving policymakers, industry and investors a more updated picture of India’s manufacturing and industrial landscape.
The April print shows that industrial growth was led by manufacturing, which expanded 6.2 per cent year-on-year. This is significant because manufacturing carries the largest weight in the IIP basket and remains central to India’s ambition of becoming a larger global production hub. The general IIP index stood at 118.9 in April 2026, compared with 113.1 in April 2025, indicating a broad rise in industrial activity.
The sectoral picture was mixed but clearly tilted in favour of factory production. Manufacturing grew 6.2 per cent, electricity and gas supply rose 4.9 per cent, while water supply, sewerage and waste management grew 6.6 per cent. Mining and quarrying contracted 5.1 per cent, reflecting weakness in extractive activity during the month. The strength of manufacturing helped offset this decline and kept overall industrial output in positive territory.
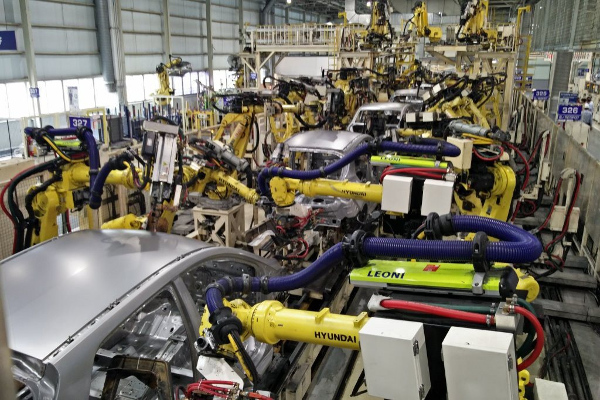
Within manufacturing, 17 out of 23 industry groups recorded positive growth in April 2026. The strongest contributors came from motor vehicles, electrical equipment, and machinery and equipment. Motor vehicles, trailers and semi-trailers grew 12.7 per cent, helped by activity in auto components, passenger cars and wheels. Electrical equipment grew 19.2 per cent, supported by switching apparatus, circuit protection equipment, carbon-based electrical products and transformers. Machinery and equipment grew 12.9 per cent, showing continued demand for production-linked industrial assets.
The use-based classification gives an even clearer view of the industrial cycle. Capital goods grew 16 per cent, suggesting healthy investment activity and demand for machinery, tools and equipment used in production. Intermediate goods grew 7.7 per cent, while infrastructure and construction goods rose 7.1 per cent. Consumer durables grew 4.3 per cent and consumer non-durables increased 2.8 per cent. Primary goods posted a modest growth of 0.8 per cent. The leadership of capital goods, intermediate goods and infrastructure-related products points to continued momentum in investment, construction and supply-chain activity.
The new IIP series is important because India’s industrial structure has changed sharply since 2011–12. The older base year captured an economy that looked very different from today’s India. Over the past decade, new manufacturing clusters, renewable energy capacity, electric mobility, electronics, rare earth-linked activity, urban utilities, gas supply and waste-management services have become more relevant. The revised series attempts to reflect this shift by updating weights, expanding coverage and adding greater sectoral detail.
The revised index now covers 463 item groups, compared with 407 under the older series. Manufacturing remains the largest component, but its item coverage has expanded from 405 to 455 groups. Mining has been made more granular with the inclusion of fuel minerals, metallic minerals including rare earths, and non-metallic minerals. Electricity has also been modernised as a category by separating renewable and non-renewable generation. Gas supply, water supply, sewerage and waste management have been added, giving the index a wider view of industrial and utility activity.
This matters for economic analysis because a modern economy cannot be measured only through traditional mining, manufacturing and electricity generation. India’s production system now includes more complex industrial chains, urban services, new energy systems and technology-linked manufacturing. A wider and more current IIP basket helps capture changes that were either missing or under-represented in the older framework.
The April data also carries a policy message. Strong growth in capital goods usually reflects confidence among businesses to invest in capacity. Growth in infrastructure and construction goods indicates continued demand from roads, railways, urban projects, logistics corridors and housing-related activity. Expansion in electrical equipment and machinery points to industrial deepening, where factories are producing the tools and systems needed for future production.
At the same time, the contraction in mining shows that India’s industrial momentum remains uneven. Mining has a direct bearing on raw material supply, power generation and heavy industry. A sustained recovery in this segment would strengthen the overall industrial picture in the coming months. For now, manufacturing has carried the April reading and given the new series a solid start.
The consumer side presents a more moderate picture. Consumer durables grew faster than consumer non-durables, showing better performance in products such as vehicles, appliances and long-use goods. Non-durables, which include everyday consumption goods, grew at a slower pace. This suggests that the investment and infrastructure side of the economy is currently stronger than mass consumption momentum.
The revised series also improves comparability with the present industrial economy, but users must read old and new figures carefully. Since the base year, item basket and sectoral coverage have changed, numbers from the old and new series are not always directly comparable. The first print under the new base series should therefore be seen as a fresh statistical benchmark rather than a simple continuation of the older trend line.
For India’s growth story, the April 2026 IIP print sends a positive signal. Manufacturing remains the main engine, capital goods show investment strength, infrastructure-linked production continues to expand, and the new data framework offers a more realistic picture of industrial activity. The broader message is that India’s factory economy is moving into a more diversified phase, where vehicles, machinery, electrical systems, utilities, renewables and modern industrial inputs are becoming more central to output.
The 4.9 per cent expansion under the revised IIP series is therefore more than a monthly industrial number. It is also a statistical reset. It captures an economy that has moved beyond the structure of 2011–12 and now requires a wider lens. With the new base year, larger item basket and better sectoral coverage, India’s industrial data is better placed to track the country’s manufacturing ambitions, infrastructure push and evolving production economy.
You may also like
-
India’s GST Collections Touch ₹1.94 Lakh Crore in May, Showing Steady Revenue Momentum
-
UPI Becomes India’s Everyday Payment Engine as Cash Loses Ground in Retail Transactions
-
India–Oman CEPA Opens a New Trade Gateway Between South Asia, the Gulf and East Africa
-
RBI’s 6.9% FY27 Growth Outlook Shows India’s Resilience Amid West Asia Risks
-
India’s Electronics Push Moves from Mobile Assembly to Deep Component Manufacturing