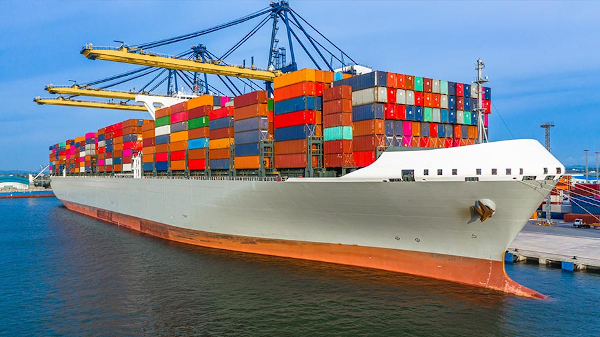
India’s total exports increased by 16.66% to US$ 568.84 billion during April–October of the financial year 2026–27, compared with US$ 487.59 billion during the corresponding period of the previous year. The expansion was supported by growth in merchandise and services exports, with electronics, engineering goods, petroleum products, agricultural commodities and several traditional industries contributing to the country’s export performance.
According to a backgrounder released by the Press Information Bureau on November 14, 2026, India’s exports registered year-on-year growth for seven consecutive months during the current financial year. Merchandise exports increased by 21.96%, while services exports grew by 10.93%, reflecting expanding international demand across multiple sectors.
The latest figures follow five consecutive financial years of record export values, with India’s total exports reaching US$ 863.1 billion in FY 2025–26.
Merchandise and Services Exports Record Strong Growth
India’s merchandise exports reached US$ 309.06 billion during April–October FY 2026–27, supported by increased overseas shipments of manufactured goods, industrial products and agricultural commodities. Services exports were estimated at US$ 259.78 billion during the same period.
During April–September, total exports reached a record US$ 479 billion, comprising merchandise exports of US$ 259.71 billion and services exports of US$ 219.27 billion. Merchandise shipments increased by 18.4% during the six-month period, while services exports grew by 10.2%.
October recorded particularly strong growth, with total exports estimated at US$ 89.99 billion, representing a year-on-year increase of 29.90%. Merchandise exports surged by 45.06% to US$ 49.47 billion, while services exports reached an estimated US$ 40.51 billion, registering growth of approximately 15.2%.
Non-petroleum exports also recorded substantial expansion, rising by 18.01% to US$ 259.22 billion during April–October. The increase indicates that export growth extended beyond petroleum-related shipments to a broader range of manufactured and agricultural products.
Electronics and Engineering Goods Lead Industrial Export Expansion
Industrial products accounted for several of the strongest increases in merchandise exports during April–October FY 2026–27. Electronic goods exports grew by 46.92%, while engineering goods registered an increase of 22%.
Petroleum product exports increased by 47.71%, plastic and linoleum products by 19.57%, and organic and inorganic chemicals by 18.21%. These figures reflect growth across different segments of India’s industrial export basket.
The electronics sector recorded particularly significant gains during April–September, when exports increased by 44% to US$ 31.97 billion. Growth was recorded in smartphones, electronic components, circuit boards, memory devices and networking equipment.
Exports of electronic products other than smartphones expanded by 56.5%, exceeding the 35.8% growth recorded in smartphone exports. Among individual electronic product categories, exports of other mounted circuit boards increased by 3,219%, while memory chips and solid-state storage devices registered increases of 2,332% and 1,681%, respectively.
Loaded circuit board exports increased by 304%, while networking equipment exports rose by 98%. Singapore, China and Hong Kong were among the major destinations for several electronic products. Malaysia emerged as the leading destination for memory chips, while the United States and the Netherlands were important markets for networking equipment.
The expansion across electronic components and finished products reflects the growing diversity of India’s electronics exports.
Agricultural Products and Traditional Industries Register Higher Exports
Agricultural commodities, processed foods and traditional products also contributed to India’s export growth during the current financial year.
During April–October FY 2026–27, exports of other cereals increased by 109.74%, while meat, dairy and poultry products recorded growth of 40.81%. Handicrafts, excluding handmade carpets, registered an increase of 36.05%.
Marine product exports grew by 13.32%, while gems and jewellery exports increased by 12.16%.
Within the agricultural sector, basmati rice exports rose by 25% to US$ 1.60 billion during April–September. Iran, Saudi Arabia and the United States were among the leading destinations for Indian basmati rice.
Frozen potato exports increased by 21% to US$ 179 million, while yellow dent corn recorded growth of 1,156%, reaching US$ 123 million. Bangladesh, Vietnam and the Philippines were among the major markets for yellow dent corn.
The figures highlight the contribution of agricultural production, food processing and traditional industries to India’s expanding overseas trade.
Indian Exports Expand Across Major International Markets
India’s export growth was accompanied by increased shipments to several major trading partners. During April–October FY 2026–27, exports to Singapore increased by 107.50%, while shipments to Malaysia grew by 106.87%.
Exports to Spain increased by 88.38%, South Africa by 62.20% and Sri Lanka by 60.42%. Other markets recording substantial growth included Hong Kong at 47.61%, Japan at 41.02%, China at 37.71% and Germany at 14.53%.
Exports to the United States increased by 14.48%, while shipments to the United Kingdom recorded growth of 13.30%.
The expansion across Asian, European, African and North American markets reflects the geographical diversity of India’s export performance.
India also recorded higher exports to countries covered by regional and bilateral trade arrangements. During April–September, exports to ASEAN countries increased by 58%, while shipments to members of the South Asian Free Trade Area grew by 22%.
Exports to South Korea increased by 24%, Nepal by 19%, Bhutan by 16% and Thailand by 7%. Among other trading partners, Oman recorded growth of 47%, Mauritius 45% and Australia 11%.
Nearly 2,000 New Product-Market Combinations Recorded
India’s export expansion included the emergence of new product-market combinations during April–September FY 2026–27.
According to the PIB backgrounder, 1,985 product-market combinations recorded exports during the period despite having no corresponding shipments during the same months of the previous financial year.
These combinations generated exports worth US$ 622.1 million, covering 116 product groups across 229 countries and territories.
Ships, boats and floating structures accounted for the largest share, generating US$ 293.3 million, equivalent to 47.2% of the total value of these newly recorded export combinations.
Silver exports contributed US$ 70.6 million, while wheat shipments accounted for US$ 61.3 million. Railway equipment and parts contributed US$ 55.8 million, and motor vehicles and cars generated US$ 9.5 million.
The figures indicate that India’s export growth was accompanied by the entry of additional products into overseas markets.
Regional Agricultural Products Reach New Export Destinations
India’s export expansion has also created opportunities for agricultural products and regional specialities from different states.
During October 2026, a shipment of 24 tonnes of frozen foods was dispatched from Sonipat in Haryana to Canada, while Erode in Tamil Nadu exported its first consignment of 1.75 tonnes of organic palmyra jaggery powder to Bulgaria.
Kanpur in Uttar Pradesh recorded its first commercial shipment of 48 tonnes of liquid glucose to Vietnam.
In horticulture, 1.3 tonnes of Sinduri pomegranates from Kullu in Himachal Pradesh were exported to Dubai, while 1.5 tonnes of kiwi fruit from Ziro in Arunachal Pradesh were shipped to the same destination.
Geographical Indication products also featured in the export expansion. Telangana dispatched its first shipment of 2.5 tonnes of GI-tagged Tandur red gram to Australia, while approximately 1.25 tonnes of GI-tagged Seoni Jumbo Sitafal from Madhya Pradesh were exported to Sharjah.
The Seoni Jumbo Sitafal shipment was sourced from a self-help group, illustrating the participation of community-based producers in agricultural exports.
These shipments demonstrate how regional agricultural products, traditional specialities and GI-recognised commodities are reaching overseas consumers.
Services Exports Strengthen India’s International Trade
Services continued to account for a substantial share of India’s total exports during April–October FY 2026–27, contributing approximately 45.7% of the combined merchandise and services export value.
India’s services exports have expanded faster than the global average over the past decade. Between 2015 and 2025, Indian services exports recorded a compound annual growth rate of 10.3%, compared with the global average of 6.6%.
Consequently, India’s share of global services exports increased from 3.1% to 4.3% during the period.
The expansion reflects India’s growing participation in international services markets and the importance of services in supporting the country’s external trade position.
Export Promotion Mission Supports MSMEs and New Exporters
The government has introduced several measures to strengthen export competitiveness, improve market access and support businesses entering international markets.
The Export Promotion Mission, approved in November 2025, has an allocation of ₹25,060 crore for the period from FY 2025–26 to FY 2030–31.
The mission combines financial and non-financial assistance to address challenges involving trade finance, international compliance requirements, market access and logistics.
It focuses particularly on micro, small and medium enterprises, first-time exporters, labour-intensive industries and businesses operating in regions with relatively low export activity.
The Resilience and Logistics Intervention for Export Facilitation component has an allocation of ₹497 crore under the mission. It is designed to assist eligible exporters, particularly MSMEs, facing higher freight charges, insurance premiums and risks arising from maritime disruptions in the Gulf and West Asia.
The government has also continued export support mechanisms under the Foreign Trade Policy 2023.
The Remission of Duties and Taxes on Exported Products scheme provides refunds of eligible taxes and duties that are not otherwise rebated. Exporters received benefits amounting to ₹77,262.60 crore under the scheme between April 2021 and December 2025.
The Rebate of State and Central Taxes and Levies scheme supports eligible apparel and made-up textile exports. During FY 2025–26, more than 15,400 exporters across over 444 districts benefited from the programme, with MSMEs accounting for a substantial proportion of beneficiaries.
District Export Hubs and Digital Platforms Expand Trade Participation
The government’s Districts as Export Hubs initiative seeks to develop export opportunities at the district level by identifying local products, improving competitiveness and connecting producers with international markets.
As of March 2026, draft export plans had been prepared for 590 districts, of which 249 had been formally adopted by District Export Promotion Committees.
The initiative is intended to strengthen participation by MSMEs, artisans, agricultural producers and other local enterprises in international trade.
Digital platforms are also being used to improve export procedures and logistics coordination.
The Trade Connect platform brings together information and services relevant to international trade, while the Indian Customs Electronic Data Interchange Gateway, known as ICEGATE, supports digital customs procedures.
The Unified Logistics Interface Platform integrates logistics information systems across government departments. By July 2026, the platform connected 46 systems across 12 central ministries through 142 application programming interfaces.
The Logistics Data Bank supports real-time tracking of export-import containers, improving shipment visibility and information exchange.
Postal export infrastructure has also expanded through Dak Ghar Niryat Kendras, which provide facilities for booking, documentation and customs clearance. As of January 2026, 1,013 such centres were operational across India.
These measures are intended to reduce procedural difficulties and improve access to international markets, particularly for exporters operating outside major industrial and commercial centres.
Special Economic Zones Support Industrial Export Infrastructure
Special Economic Zones remain an important component of India’s industrial and export development strategy.
As of July 2026, India had notified 372 Special Economic Zones. Eight additional SEZs were notified during FY 2026–27, covering sectors including semiconductors, electronics, information technology, infrastructure and data centres.
Among the notified projects was a proposed semiconductor and electronics manufacturing SEZ associated with Tata Semiconductor Manufacturing Private Limited at Dholera in Gujarat, with an indicated investment of approximately ₹91,000 crore.
Other notified projects included semiconductor and electronics facilities in Odisha and Chhattisgarh, as well as IT and data-centre-related developments in Uttar Pradesh, Tamil Nadu, Andhra Pradesh and Puducherry.
The proposed investments and employment figures associated with these projects represent development plans rather than completed investments or employment generation.
The expansion of SEZ infrastructure forms part of the government’s wider effort to strengthen manufacturing capacity, attract investment and support export-oriented industries.
Export Growth Accompanies Broader Economic Expansion
India’s export performance during FY 2026–27 has coincided with growth in domestic economic activity and improvements in several macroeconomic indicators.
Real GDP expanded by 7.8% during April–June FY 2026–27. The Reserve Bank of India and major international institutions, including the International Monetary Fund, World Bank and OECD, projected economic growth in the range of 7% to 7.1% for the financial year.
Labour market indicators also showed improvements during July–September 2026. The unemployment rate among people aged 15 years and above declined to 5.1%, compared with 5.4% during April–June.
Rural labour force participation increased from 56.9% to 58.1%, while urban participation rose from 50.2% to 50.4%.
Net foreign direct investment inflows increased to US$ 8.8 billion during April–September 2026, compared with US$ 7.4 billion during the corresponding period of the previous year.
India’s foreign exchange reserves stood at US$ 719.55 billion as of November 6, 2026.
These indicators provide the broader economic context in which the country’s merchandise and services exports have expanded.
India Records Seven Consecutive Months of Export Growth
India’s export performance during April–October FY 2026–27 reflects growth across industrial products, agricultural commodities, traditional industries and services.
The increase in electronic goods, engineering products, agricultural exports and shipments to major international markets demonstrates the range of sectors contributing to overseas trade.
The emergence of new product-market combinations and shipments of regional agricultural specialities also highlights the participation of a wider range of producers in export activity.
Government initiatives involving export finance, trade facilitation, district-level export development, infrastructure and logistics are intended to support this expansion by addressing barriers faced by exporters.
With total exports reaching US$ 568.84 billion during the first seven months of FY 2026–27, India has recorded seven consecutive months of year-on-year export growth, supported by increases in both merchandise and services shipments.
You may also like
-
Indian Railways Approves Weekly Train Service Connecting Nepal’s Janakpur Dham with Ayodhya
-
Kandhamal Haladi of Odisha: The GI-Tagged Heritage of the Eastern Ghats’ Golden Turmeric
-
India’s Renewable Energy Capacity Expands as Solar Power Reaches 175 GW and Wind Power Crosses 59 GW
-
India Advances ₹68,816 Crore Ultra-High-Voltage Transmission Corridor to Strengthen National Power Grid
-
India’s Exports Rise 16.66% to $568.84 Billion During April–October 2026–27
