New Delhi: Goods and services tax (GST) collections crossed the Rs1-trillion mark for the second time in 2018-19.
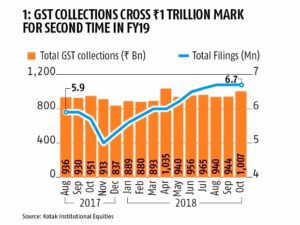 As seen in Chart 1, collections rose to Rs1.01 trillion in October, up from Rs944 billion in September. Collections had previously touched Rs1.04 trillion in April.
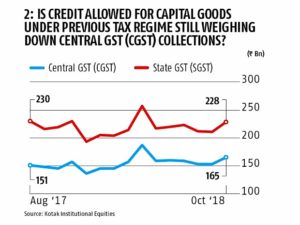 The disaggregated data shows that Central GST (CGST) collections continue to remain well below state GST (SGST) collections (Chart 2). One possible explanation is that credit allowed for capital goods under the previous indirect tax regime could still be weighing down CGST collections.
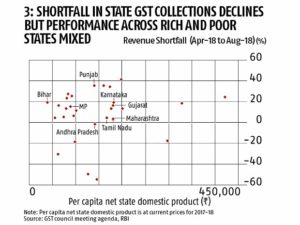 On the states’ side, while the shortfall in collections has declined, it continues to remain high in some states such as Punjab, Himachal Pradesh and Uttarakhand. However, as seen in Chart 3, there does not appear to be a conclusive trend across rich and poor states. Bihar and Karnataka have similar levels of revenue shortfall despite being at different levels of development.
On its part, the government had hoped that the introduction of the e-way bill would help improve compliance.
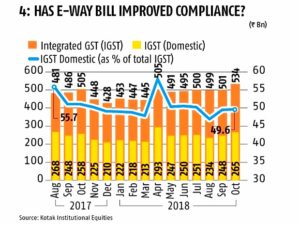 However, as seen in Chart 4, the data on integrated GST (IGST) domestic collections does not show a sustained increase in collections post the rollout of the e-way bill. The shortfall in the Centre’s GST collections has raised concerns over it meeting the fiscal deficit target of 3.3 per cent of GDP.
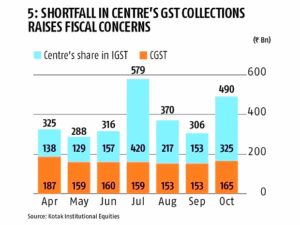 As seen in Chart 5, the Centre has mopped up Rs2.6 trillion in the first seven months of the financial year, leaving it with only five more months to meet the budgeted target (Chart 6).
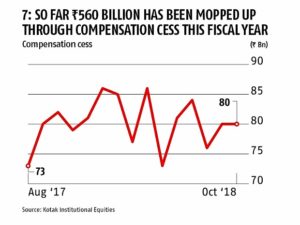 The Centre could benefit from the division of the unallocated portion of the GST compensation cess. So far Rs560 billion has been mopped up through the compensation cess (Chart 7).
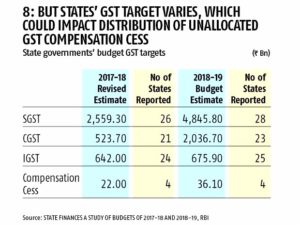 But it’s difficult to estimate the Centre’s gain as states have differed in their reporting of GST revenues, as noted by the Reserve Bank of India in its study on state budgets (Chart 8).
Source: BS
Image Courtesy : BS
You may also like
-
Trade Connect E-platform For Exports Is Single Window, Fast, Accessible And Transformational: Shri Piyush Goyal
-
Dot Simplifies Approval Processes For Telecom Licenses And Wireless Equipment
-
Coal Production and Supply Trends on Positive Trajectory
-
Union Minister To Release Booklets On Promotion Of Indigenous Species & Conservation Of States Fishes
-
2nd India-Japan Finance Dialogue held in Tokyo on 6th September, 2024
